XLA User Guide
Overview
The XLA DEX Pack Lite dashboard uses data from the IT User Experience Survey and combines it with device health scores to provide an overall XLA score. This score helps IT teams monitor and improve the end-user experience.
NOTE: The XLA DEX Pack Lite only works with results from the factory survey called IT User Experience Survey.
If you have not set up the Survey for your users, refer to the Survey Scheduler article for more information.
Score
The top three colored text boxes show you key metrics from the last 30 days:
-
SysTrack Health Score: Ratio of how long users were active on the system against the total amount of time the system was impacted by resource constraints and IT problems. For more details, see the Health Score Details article.
-
User Sentiment: Average response for the Please provide a rating for your overall experience question from the IT User Experience Survey.
NOTE: The dashboard displays the sentiment score on a 0 to 100 scale, while the source data uses a -1 to 1 scale. This conversion ensures consistency with other metrics collected for similar purposes. For more information, refer to the Sentiment Scoring for SysTrack AI Conversations article.
-
XLA Score: Combined metric from the SysTrack Health Score and User Sentiment based on weighting.
Above the text boxes you can see a couple of filters to help you focus on the data you need.
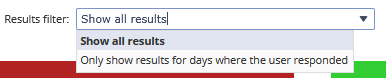
Results Filter:
The sentiment score data is carried over on days when a user has not submitted a response. For example, if a user responds on the 20th with a score of 50 and again on the 25th with a score of 70, the score displayed from the 20th through the 24th is 50. Starting on the 25th, the score updates to 70 and remains until a new response is received. The dashboard displays results from the last 30 days, but the most recent response older than 30 days is still carried forward.
Using the results filter, you can choose whether you wish to include the carried over scores or not.
-
Show all results: Includes health scores even if the survey wasn’t answered.
-
Only show results for days where the user responded: Includes health scores only for days with survey responses.
Weighting Slider
If there are too few survey responses, user sentiment may have little impact on the XLA Score. To address this, use the weighting slider to adjust the balance between Health Score and user sentiment in the XLA Score.
-
Middle position = 50/50 weighting.
-
Move left or right to favor one metric.

Graphs and Tables
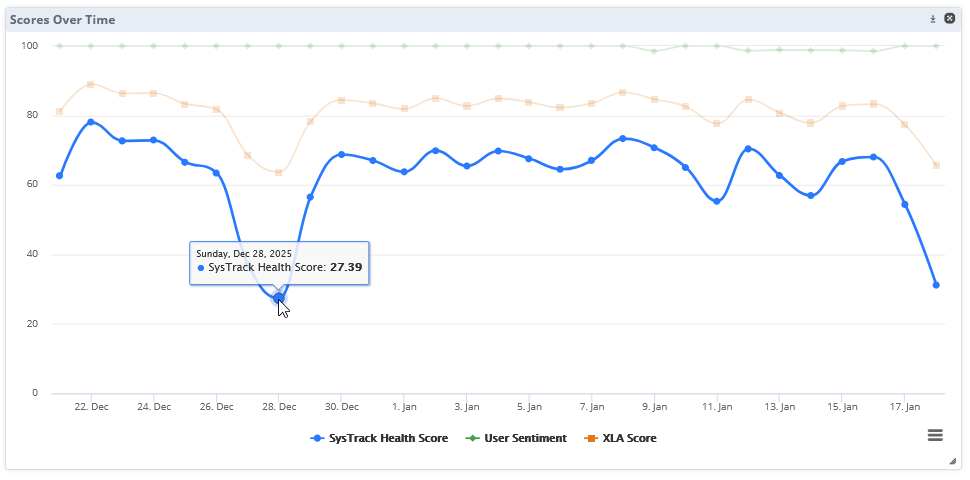
Score Over Time
Shows daily scores for Health, Sentiment, and XLA from the last 30 days. Select any of the days in the graph to see the details in the Selected Date Results table.
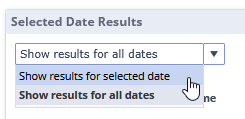
Selected Date Results
By default, the table shows data for the last 30 days. You can filter the data for a specific date by selecting Show results for selected date in the drop-down menu above the table.
Click on any row in the table to populate the belowSelected User widgets with data. You can also double click on any of the rows in the System column to go to the Resolve > Black Box view of that system.
Selected User Results
-
Selected Users - Score Over Time: Daily scores for Health, Sentiment, and XLA from the last 30 days for the user selected in the Selected Date Results table.
-
Selected Users - Survey Responses: Responses to the IT User Experience Survey from the user selected in the Selected Date Results table.
On This Page